
Calculating the Distance Lesson by Rick Hansen Foundation
In this lesson, students complete grade-appropriate math problems using facts and figures from Rick Hansen’s Man In Motion World Tour. Students will examine mathematical problems evolving out of the day-to-day challenges of Rick Hansen’s Man In Motion World Tour. Students will apply multiplication and division skills to real-life math problems. Students will apply conversion skills to real-life math problems.
Image Description: Logo of Rick Hansen Foundation.

Circles Lesson Plan
This lesson will use wheelchair wheels to teach the concept of circles. Students will identify circles in wheelchair wheels and then draw/sculpt their own.
Image description: 2 wheelchairs and 4 circles
Designing with Disability in Mind
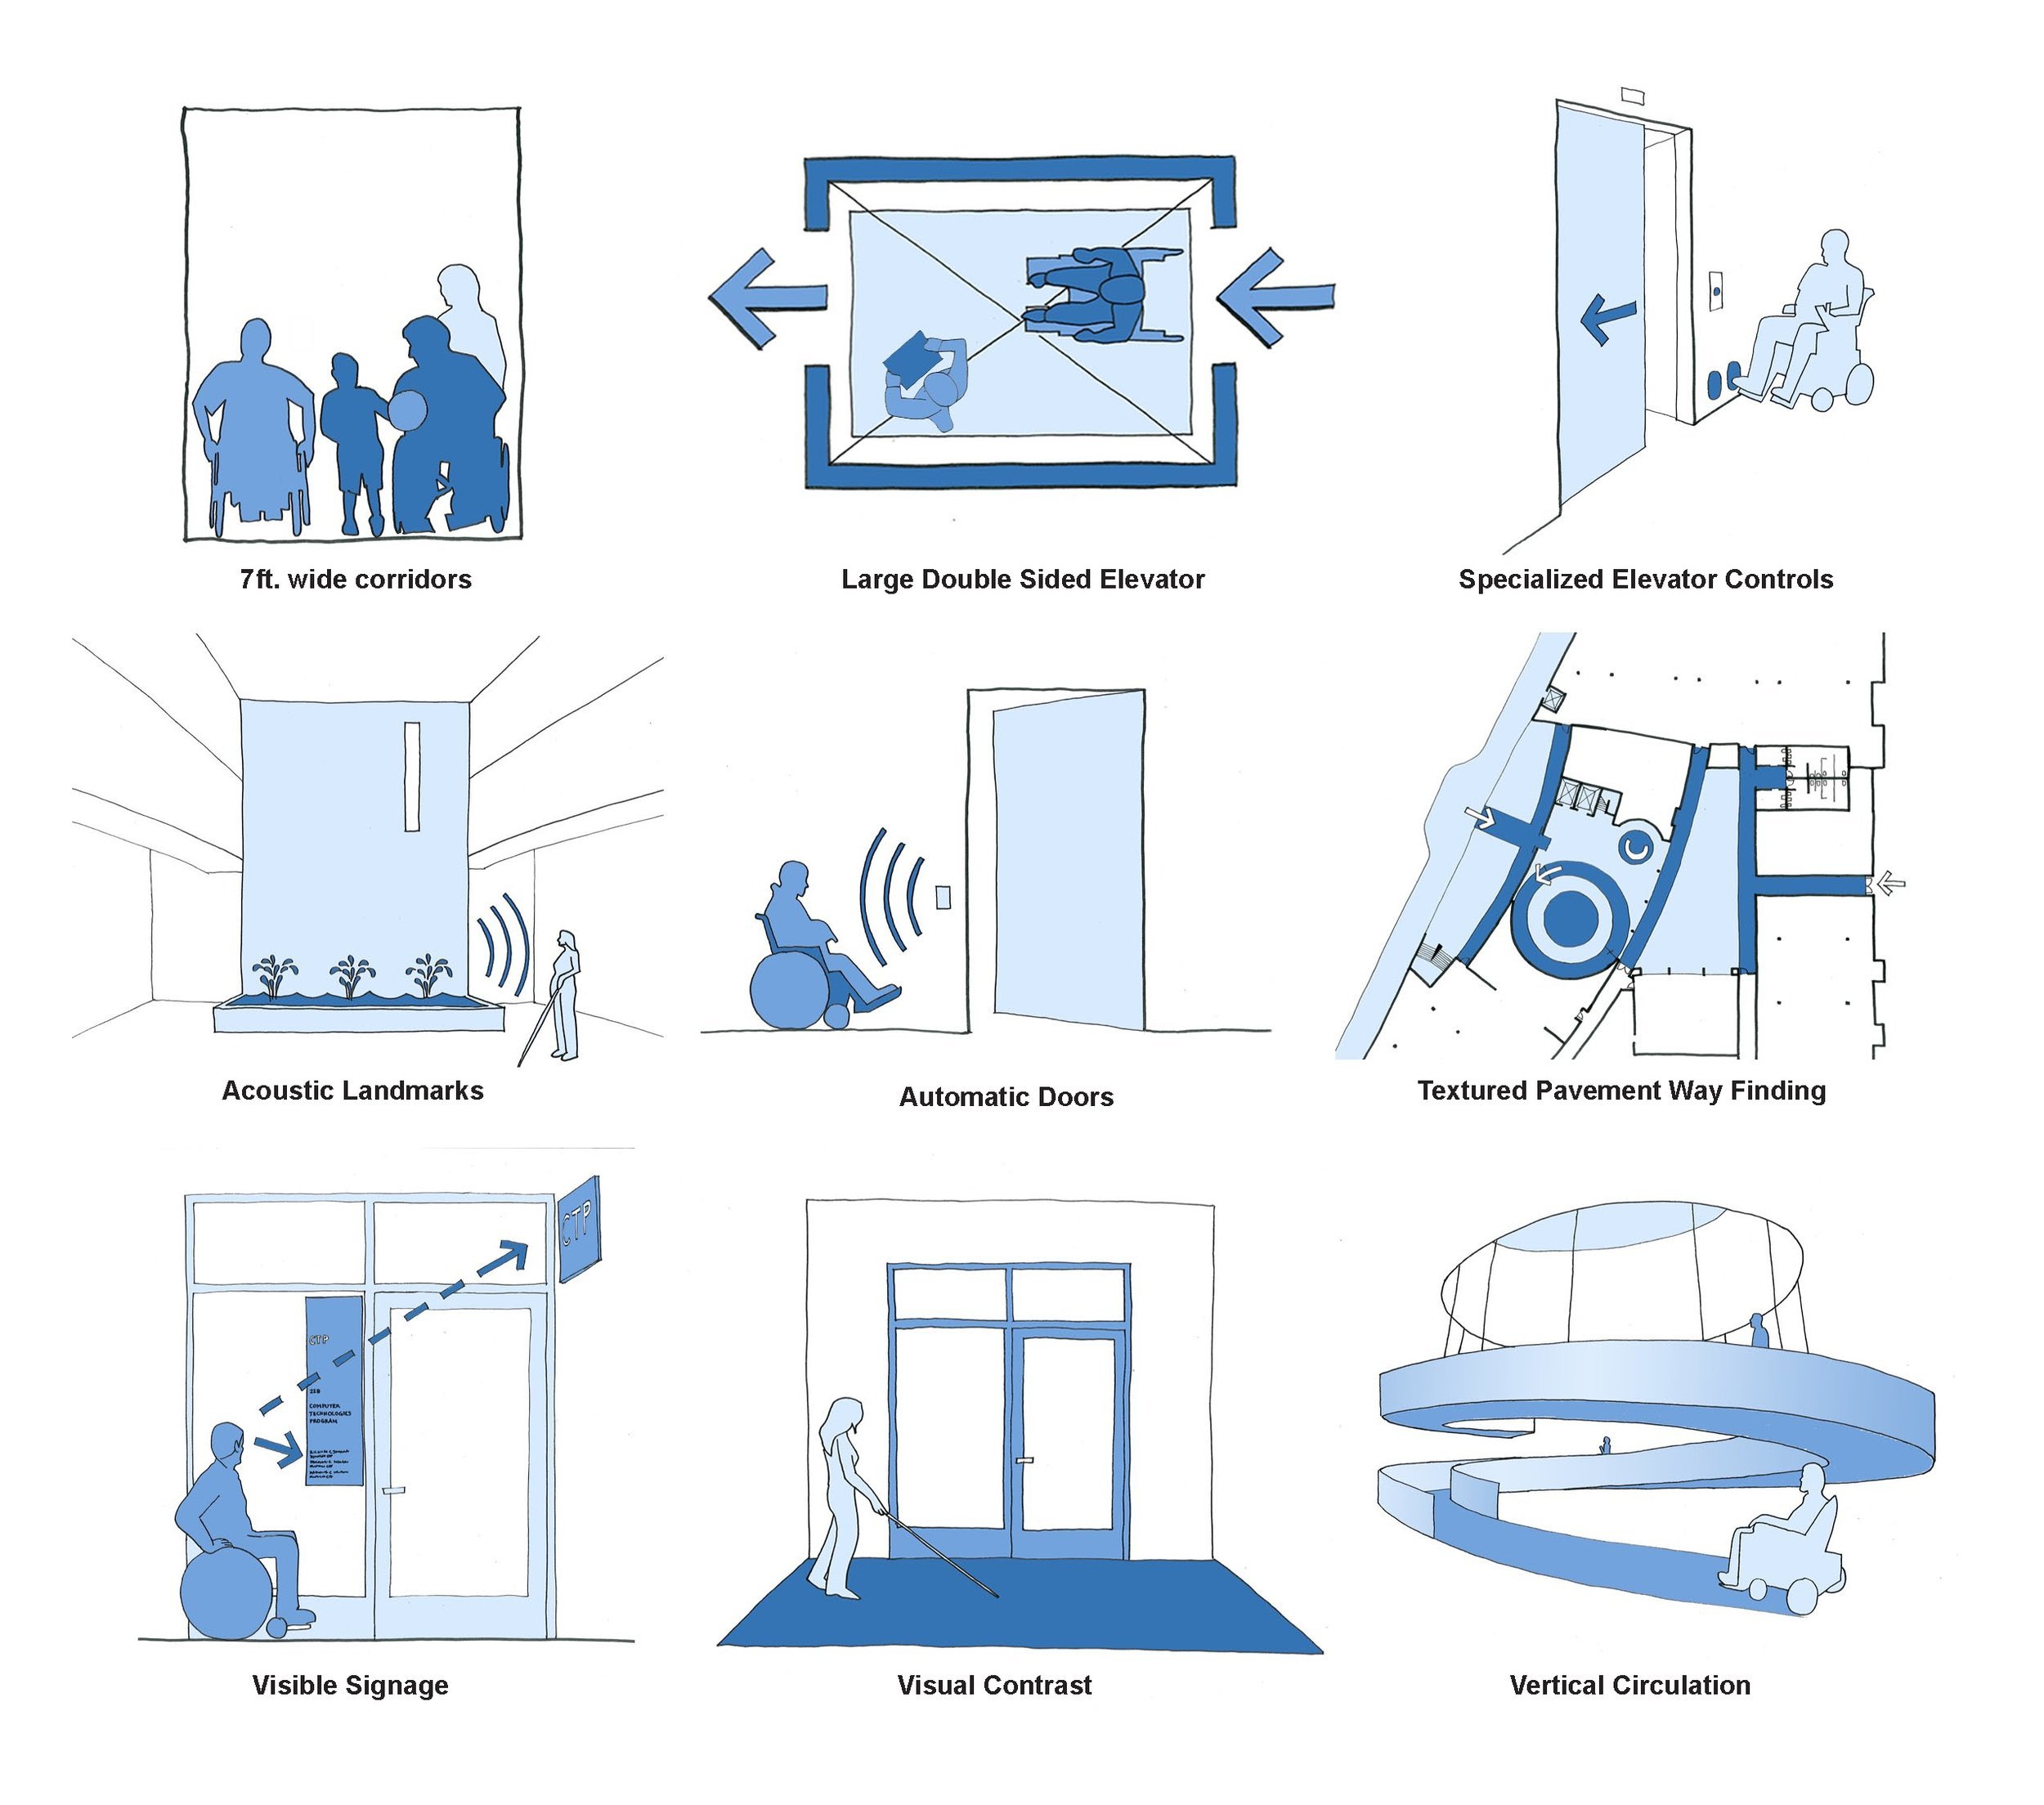
This lesson plan combines geometry with social awareness by exploring some of the principles of universal design and accessibility.
Over two class periods, students review key geometric concepts such as area, perimeter, and volume, and apply these concepts to redesign public spaces to meet accessibility standards. Through video content, class discussions, and hands-on design activities, students learn the importance of creating inclusive environments for people with disabilities. To share their work and demonstrate their learning, students will engage in a “gallery walk” to debut their group presentations of redesigned floor plans.
Image Description: Graphic showing 9 features of accessible design used at the Ed Roberts Campus

It Feels Like Spring: How We Experience the Seasons Through Our Senses
After listening to the book, “Naomi Knows It’s Springtime” by Virginia Kroll, the students will consider how Naomi experiences springtime, and how they experience springtime with the senses they have. Then, they will further explore the tactile experience of springtime objects combined with a Math lesson.
Image description: Cover of the book “Naomi Knows It’s Springtime" showing a grassy field, someone pushing a lawnmower in the background, a girl with braided hair and a dog to her side, tail in the air, facing us seated at a garden
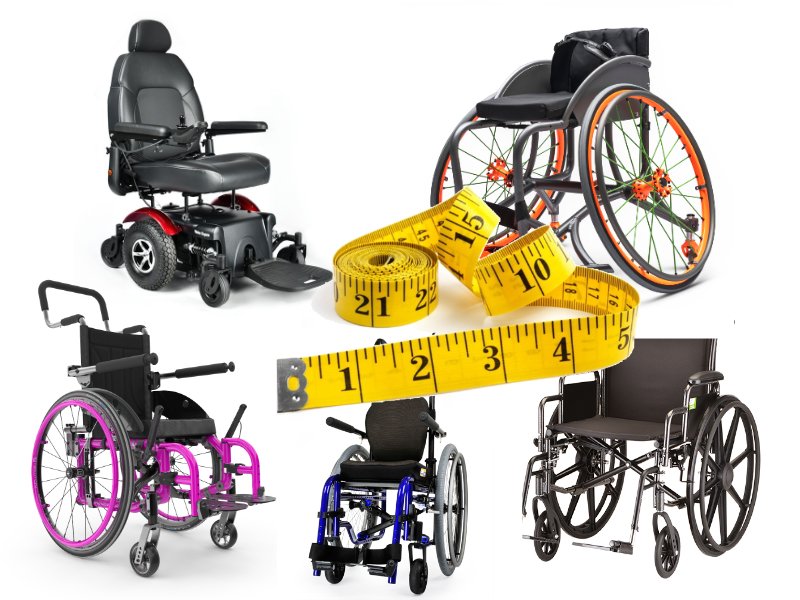
Measurement Lesson Plan
This lesson will help teach measurement by having students estimate the width of doorways and then measure doorways to determine if they are wide enough to meet ADA standards.
Image description: 5 wheelchairs with a yellow tape measure curled over them

Statistics and Disability Representation
This lesson integrates statistics with disability acceptance to enhance both mathematical understanding and social awareness. Over the course of three class periods, students analyze statistical data related to disabilities such as employment rates, educational attainment, and media representation. Students will then create various types of graphs, and discuss the representation and treatment of people with disabilities in society.
The lesson includes a mix of video content, group discussions, data analysis, and presentations, culminating in a reflection activity to deepen students' empathy and awareness. By engaging with real-world data, students develop their skills in calculating mean, median, mode, and range, while also promoting inclusivity and acceptance.
Image Description: Person in wheelchair pointing to a stylized web browser with various graphs and charts on it. The accessibility icon is in the bottom left-hand corner.
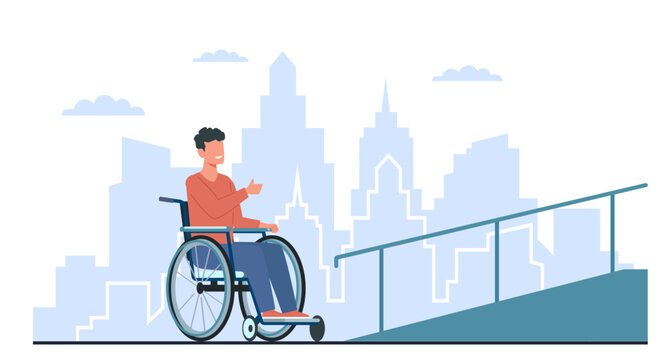
Understanding Ramp Slope and Disability Accessibility
In this lesson, students will explore the concept of slope, learn to calculate it using coordinates, and graph linear equations. They will apply this knowledge to real-world scenarios, such as designing wheelchair ramps, and emphasizing accessibility. Additionally, students will learn about universal design principles and the importance of considering people with disabilities in their designs.
Image Description: graphic of a person seated in a wheelchair at the base of a ramp with a handrail. A faded city skyline is in the background.